If you’ve perused this website then you may know that I use Python extensively for post processing my simulations. I use Python because of the easy syntax, automation, and its extensive data science libraries. Python seems to have an endless number of packages that can do pretty much anything you require in the post processing or data science field. Paraview, a great visualization tool for simulations, is even written in Python. Therefore, it’s only natural that I use it for my post processing.
When running CFD-DEM (fluid-particle) simulations, I output all collisions to particles using the command to compute local pairwise collisions in LIGGGHTS©
compute frc all pair/gran/local pos vel id force_normal force_tangential contactArea
I then dump this computation to files using
dump dmp_frc1 all local 333 ../DEM/post/force/dump_frc_* c_frc[1] c_frc[2] c_frc[3] c_frc[4] c_frc[5] c_frc[6] c_frc[7] c_frc[8] c_frc[9] c_frc[10] &
c_frc[11] c_frc[12] c_frc[13] c_frc[14] c_frc[15] c_frc[16] c_frc[17] c_frc[18] c_frc[19] c_frc[20] c_frc[21] c_frc[22]
More information can be found at .https://www.cfdem.com/media/DEM/docu/compute_pair_gran_local.html but I’m essentially outputting all pairwise collisions data occurring at the specified time interval. I start running this dump when I reach a pseudo-steady state in my simulations.
Now that I have files with all my collisions data, I might, for example, want to generate histograms of particle collisions to better visualize or calculate the min/max, mean, and variance of all collisions. There could be collisions that aren’t significant and therefore I want to filter them out or I could want to group by location as demonstrated by Figure1. Hence the reason I picked Python, it is a data scientist’s greatest ally.
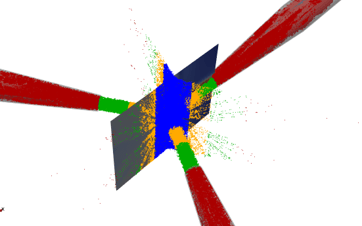
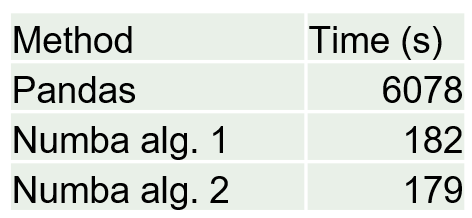
I might also want to filter by particle location as shown in Figure1. I first started by using Pandas toolbox because it is relatively easy to implement. This worked but once I started getting into the very large amount of particle collisions this proved to be extremely slow. Sometimes I would have to run my code for 6 hours to filter the particles.
I knew the cause of this was using Pandas because although Pandas is a very intuitive and useful module for data management of smaller amounts of data it still uses Python’s back end to solve and is therefore slow. I needed C++ or Fortran, which are the gold standards for speed. The Numba Python package provides this solution at the compiler level that produces the speeds of C++ and Fortran with For Loops. Therefore I converted my Pandas Dataframes of collisions to Numpy arrays and made my filter functions of For Loops with compiler flags for Numba as shown in the code snippet given by
@nb.jit(nopython=True)
def custom_filter2(arr, columnNumber,min,max):
    n, m = arr.shape
    k = 0
    for i in range(n):
        if arr[i, columnNumber] >= min:
          if arr[i, columnNumber] < max:
            k += 1
    result = np.empty((k, m), dtype=arr.dtype)
    k = 0
    for i in range(n):
        if arr[i, columnNumber] >= min:
          if arr[i, columnNumber] < max:
            result[k, :] = arr[i, :]
            k += 1
    return result
When I changed to NumPy Arrays and Numba I saw an astonishing speedup time of over 33. Granted, I wasn’t the most efficient when writing my Pandas code to begin with but even with the most efficient Pandas code I cannot even touch the speed of Numba. That’s C++/Fortran for you!